


In June 2009, the coming of summer brought beautiful sunny days up and down the eastern seaboard of the U.S. But then something weird, almost creepy, happened in the mid-Atlantic between June 19 and 24: Waters started spilling across roads, across intersections, and under houses in places like Carolina Beach, North Carolina. Phones at the National Oceanic and Atmospheric Administration (NOAA) in Silver Spring, Maryland were ringing, and scientists could only observe that water heights were as much as 2 feet higher than they had predicted. Normally only a storm would create that kind of rise. But there was no storm to be seen.
The mystery of sunny day flooding was assigned to William Sweet, who was in his first year on the job at NOAA. With two colleagues, he began to dig into current and historical data on weather and oceanic currents from NOAA’s vast collection of tide gauges and satellite images. What they discovered was that steady northeasterly winds were piling up seawater off shore, raising water levels. That was coupled with a shift in the behavior of the Florida Current mixing into the Gulf Stream. And finally, there was an exceptionally high tide providing the last bit of lift. Normally, no single one of these things—the winds, or the current shift, or the tide—would have caused flooding, but combined together, on top of sea levels that have risen 3 to 5 millimeters every year over the past century, they did. The scientists named it the “Elevated East Coast Sea Level Anomaly.” In more epic terms, it was a perfect nuisance flood.
Rising sea levels are a moving target—a study published the other week in the journal Nature suggests that the oceans could rise 5 or 6 feet by 2100, twice the rise predicted three years ago, because of accelerated ice melting in the poles. This prediction brings with it a cloud of uncertainty—when will the rises occur, and where? However, the year’s highest tides, driven by the alignment of the Earth, the moon, and the sun, provide an uncanny dress rehearsal for our future with higher seas, a rare crystal-ball-like guide to certain future trouble, and a catalyst for a worldwide group of citizen scientists and infrastructure buffs.
These “king tides,” scientifically known as perigean spring tides, don’t determine when flooding will occur in the low-lying coastal communities where water is already a nuisance, but they’re strongly tied to it. You might think of them as the tip of the melting iceberg.
Until recently, perigean spring tides were mostly the domain of astronomers, oceanographers, sailors, and other ocean groupies. Perigean spring tides occur a few times a year when the sun, moon, and Earth are aligned and the moon is at its closest distance to the Earth, aka the perigee. (They may or may not occur in the spring; “spring” in this case refers to the way they elevate the tide.) During full or new moons, the combined gravitational pull of the sun and the moon cause Earth’s oceans to bulge in a long wave, raising tides by an extra few inches in some places, and a few feet in others.
Sweet became NOAA’s expert in perigean spring tides and nuisance flooding because he likes doing the complex mathematical calculations necessary to understand how tides work at certain times and in certain places. NOAA’s hundred-year-old network of gauges gives a precise record of sea levels in the U.S. and around the world over time. This allows Sweet to study the difference between predicted tide levels and actual ones, while observing the slow, steady rise in sea levels themselves.
In 2014, he went on to look at 45 places in the U.S. that experience regular nuisance flooding, not just from storms, but on sunny days. These include places like Sandy Hook, New Jersey, which had two nuisance flooding days a year in 1960 and 21 in 2014. During the same period Annapolis, Maryland, went from four to 41, while Key West, Florida, went from zero to three. In all, flooding days in Baltimore were up 920 percent; Port Isabel, Texas, was up 547 percent; San Francisco, 364 percent. Sometimes the floods were caused by winds, or storms, or changes in barometric pressure; sometimes these combined with perigean spring tides on a lovely day. Years with El Niño, the warm phase of a recurring climate pattern in the tropical Pacific, pushed up the number of floods directly on the West Coast, and indirectly on the East coast.
Rising sea levels are dramatically increasing the frequency of nuisance flooding. In spots that have experienced flooding, one or two floods a year has turned into eight and then 20, and then more than 40. “It’s a non-linear accelerating response, and these tipping points will happen well before 2100,” says Sweet. Each area, he says, needs to develop a situational awareness—a sense of their vulnerabilities, the weather, and the tides—and then use that to decide when to install new pumps in the storm drains or raise the roads.
The drive for better worldwide situational awareness has led to the King Tides Project, an international effort to get citizens to photograph nuisance flooding, increase understanding of the impacts of rising sea levels, and help local towns figure out what they need to do. The amateur photography projects (“Snap the shore. See the future”) offer up fascinating collections of flood shots on every continent except Antarctica. A variant of this homemade flood porn is an excellent three-day perigean spring tide video from the University of Delaware’s Sea Grant program, which does marine research. On the first day, the high tides alone push water onto the roadway; on the second, barometric pressure increases flooding; and on the third, the chaotic energy of a storm pushes floods even higher, and partially unlashes the camera.
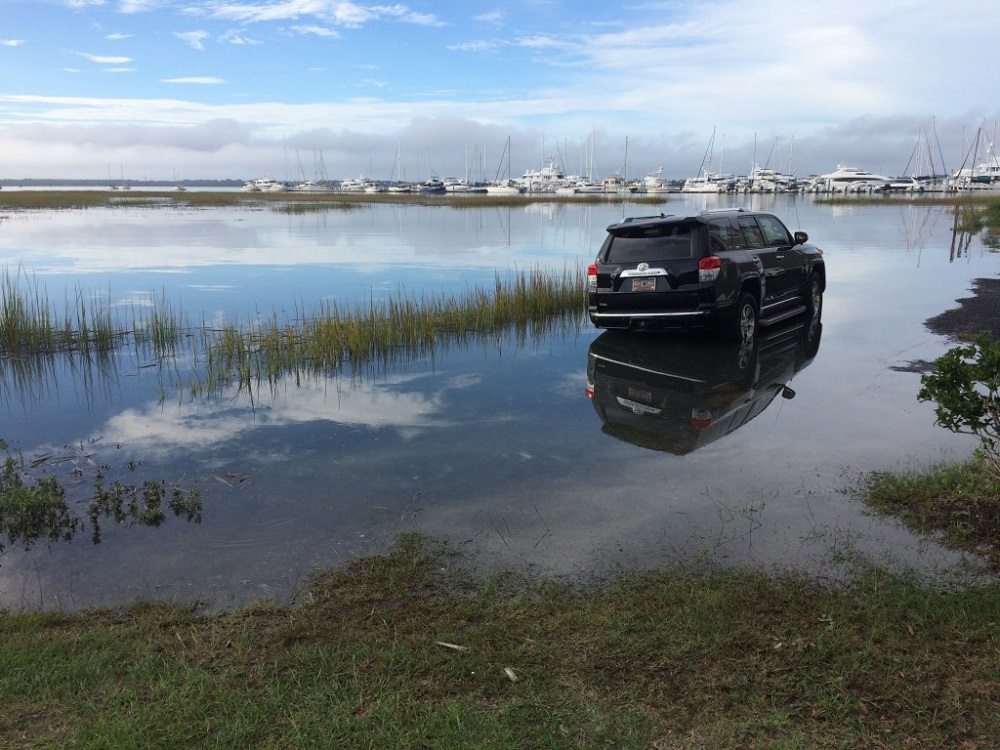
It’s one thing to talk about situational awareness; it’s another to get it delivered to you directly. Mine came late last September, when I parked my car in its usual spot by the edge of the tidal Kennebec River in downtown Bath, Maine. We’d had a lot of rain and the river was swollen with muddy water and forest debris washing down from the interior of the state. It was a beautiful sunny day, and I stopped to admire the incongruity of the violent khaki water containing whole horizontal pine trees whirling erratically. And then I went into my office and got to work until the early afternoon, when Toby, my office mate, said, “Hey! Look at your car.” Water from the river had lapped over the pilings into the parking lot and now reflected my dopey old VW Golf from all angles, like one of those mirrored cake plates. I ran out to move it, splashing through the puddle. I was lucky: Downriver, waters took out an electrical substation and damaged cars belonging to workers on their shifts. The river was high with water and debris from the storm, but the flooding roughly coincided with the September 28 perigean high tide, too.
And so the gravity of the moon had provided me with a glimpse of our future: Even a small rise in sea level, combined with a random sloshing of other factors, will eventually drown the street my office is on.
We can put this information to work by looking at perigean spring tides of the future. Have you made plans for Thanksgiving 2034 yet? If you’re considering eating turkey in Baltimore or Port Isabel, consider making reservations for at least the second floor. How about San Francisco? Please plan ahead for the possibility that when you want to depart on Saturday, November 25, after Thanksgiving, the airport runways may be flooded while filthy water bubbles upwards from the storm drains. No app, unicorn, or disruptor will be more helpful than a very tall pair of rubber boots. May I suggest celebrating somewhere high? Denver, Texas Hill Country … oh heck, even Plymouth, Massachusetts (elevation 187) will do. And then there’s December 6, 2052 …
Send A Letter To the Editors